Senior Forest Research Data Scientist
Through an interactive mapping tool, we highlight opportunities to protect drinking watersheds up and down the Oregon coast

A majority of Oregonians depend on forests for their drinking water. In fact, surface water, the kind that comes from forest streams, rivers, and lakes, provides a full 70 percent of all water used in the state, with 163 communities dependent on this water to fill their daily needs.
Surface water is vulnerable to a variety of pollution sources: Steep forest slopes prone to landslides, eroding stream banks, and fires can lead to spikes in sedimentation. Riverbank erosion, road-building near streams, boat ramps, and agricultural chemicals-fertilizer, herbicides, and pesticides—are all potential sources for contamination. And, since so much of our surface water comes from forests, the location, method, and scale of timber harvests play a part as well.
To protect drinking water, the Oregon Department of Environmental Quality established Drinking Water Source Areas (DWSAs)—geographic designations that indicate where surface water flows before being delivered to communities—throughout the state.
Developing local strategies to protect their DWSA is one of the best ways Oregonians can address the array of potential pollution sources, ensure safe drinking water, and minimize future treatments costs. While the Department of Environmental Quality provides resources related to source water protection, we saw a gap in available information that illustrated the correlation between surface drinking water, land ownership, and past and potential future timber harvest activity.
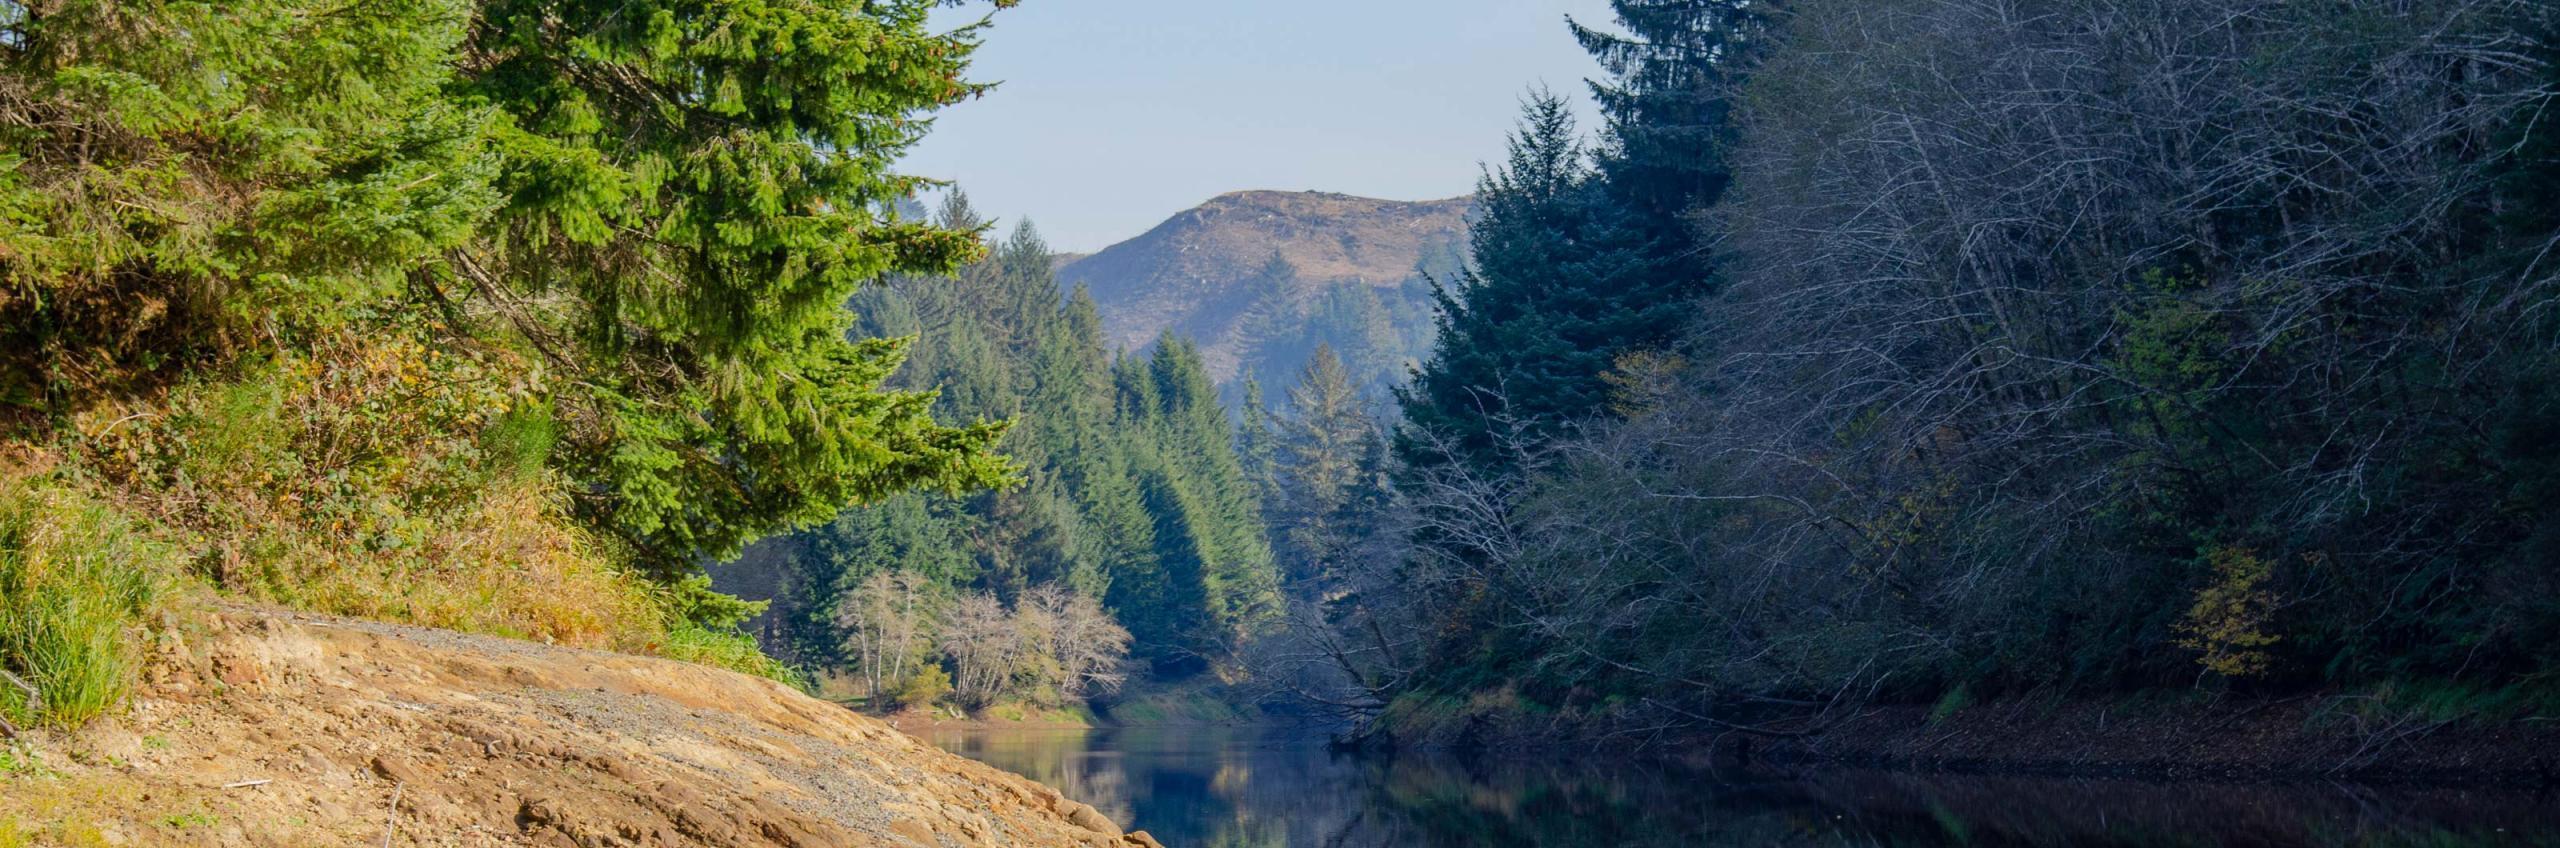
The Big Creek reservoir outside Newport, Ore. Megan Foucht
Our earlier research, supported by the U.S. Endowment for Forestry and Communities, laid the groundwork for this approach. In 2015, we began analyzing drinking water security for communities on the north coast of Oregon and southwest corner of Washington. We looked at 17 forested drinking watersheds in this region and quantified how much of each had been harvested over the past 20 years. Using Landsat imagery (space-based moderate-resolution land remote sensing data and imagery), we identified all areas of forestry activity that included clearcut harvest. We then identified areas that had not been cut in the past 20 years on publicly- and privately-owned land.
Based on common harvest rotations on private land, forests that had not been cut are likely to be most vulnerable to harvest now. Many of the watersheds we analyzed have areas ripe for restoration and protection.
Partners were interested to see if findings were similar for the whole state of Oregon and the coast in particular. This inspired a collaboration with the Northwest Community Forest Coalition and Sustainable Northwest, with support from Meyer Memorial Trust, to gain a more comprehensive understanding of water security in the state, and put that information in the hands of communities.
This recent and far more extensive picture of Oregon’s watersheds is a compilation of publicly-available demographic, ecological, and topographic data, forest age, and land ownership information for all 154 of Oregon’s DWSAs. Then, layering satellite imagery from the last 30 years, we created maps that show the cumulative harvest in each DWSA.
Click on a region in the map to see harvest levels over the past 30 years.
Many coastal source water areas, whether privately- or publicly-owned, host a higher percentage of recently-harvested forest land than other ecological zones across the state.
As seen in the map above, 94 percent of Drinking Water Source Areas in the Coast Range are forested, with 35 percent of those forested areas having recently been cut.
Of the 50 Drinking Water Source Areas in the Coast Range, 10 have had more than 50 percent of their forests cut in the past 10 years; and 18 have at least 10 percent of their forests approaching common harvest age, having been cut 20 to 30 years ago. Fortunately, 40 of these DWSAs contain at least 50 percent mature forests—however, depending on ownership, these DWSAs are now vulnerable to harvest. These data demonstrate a large variance between the harvest rates in coastal DWSAs: Some have had zero logging activity, while others have seen up to 86 percent harvest rates.
In addition to timber harvest activities, coastal watersheds are increasingly impacted by development from growing populations, as well as a host of climate-related disturbances—from wildfire and drought, to more severe winter storm systems that bring heavy rains and a rise in landslides and erosion. These influences, along with the disparate harvest rates during the past 30 years, speak to the need for a range of local solutions.
To help coastal communities plan for a more populous and increasingly climate-constrained future, we published data and information specific to the 50 coastal communities that depend on surface sources for drinking water in this interactive web tool. Through this interface, coastal community members, city managers, utilities service providers, and others can learn more about where their drinking water comes from and its current state of vulnerability. By providing landscape-level context for this important resource, these maps may be useful in helping communities develop and implement drinking water protection strategies.
Our hope is that this tool is useful to a large variety of people working to ensure drinking water security for coastal residents. A clean water advocacy organization could use it to prioritize outreach to communities based on the number of potential contamination sites. Coastal city planners can explore where easements or other green infrastructure investments might have the most impact. Students can use it to study the influence of physical geography in their own backyard by assessing landslide probability. Perhaps most notably, coastal city council and community members can come together to explore options for high-priority forest restoration and protection efforts, including land acquisition—one of the best ways to ensure public water supply is protected for the long-term.
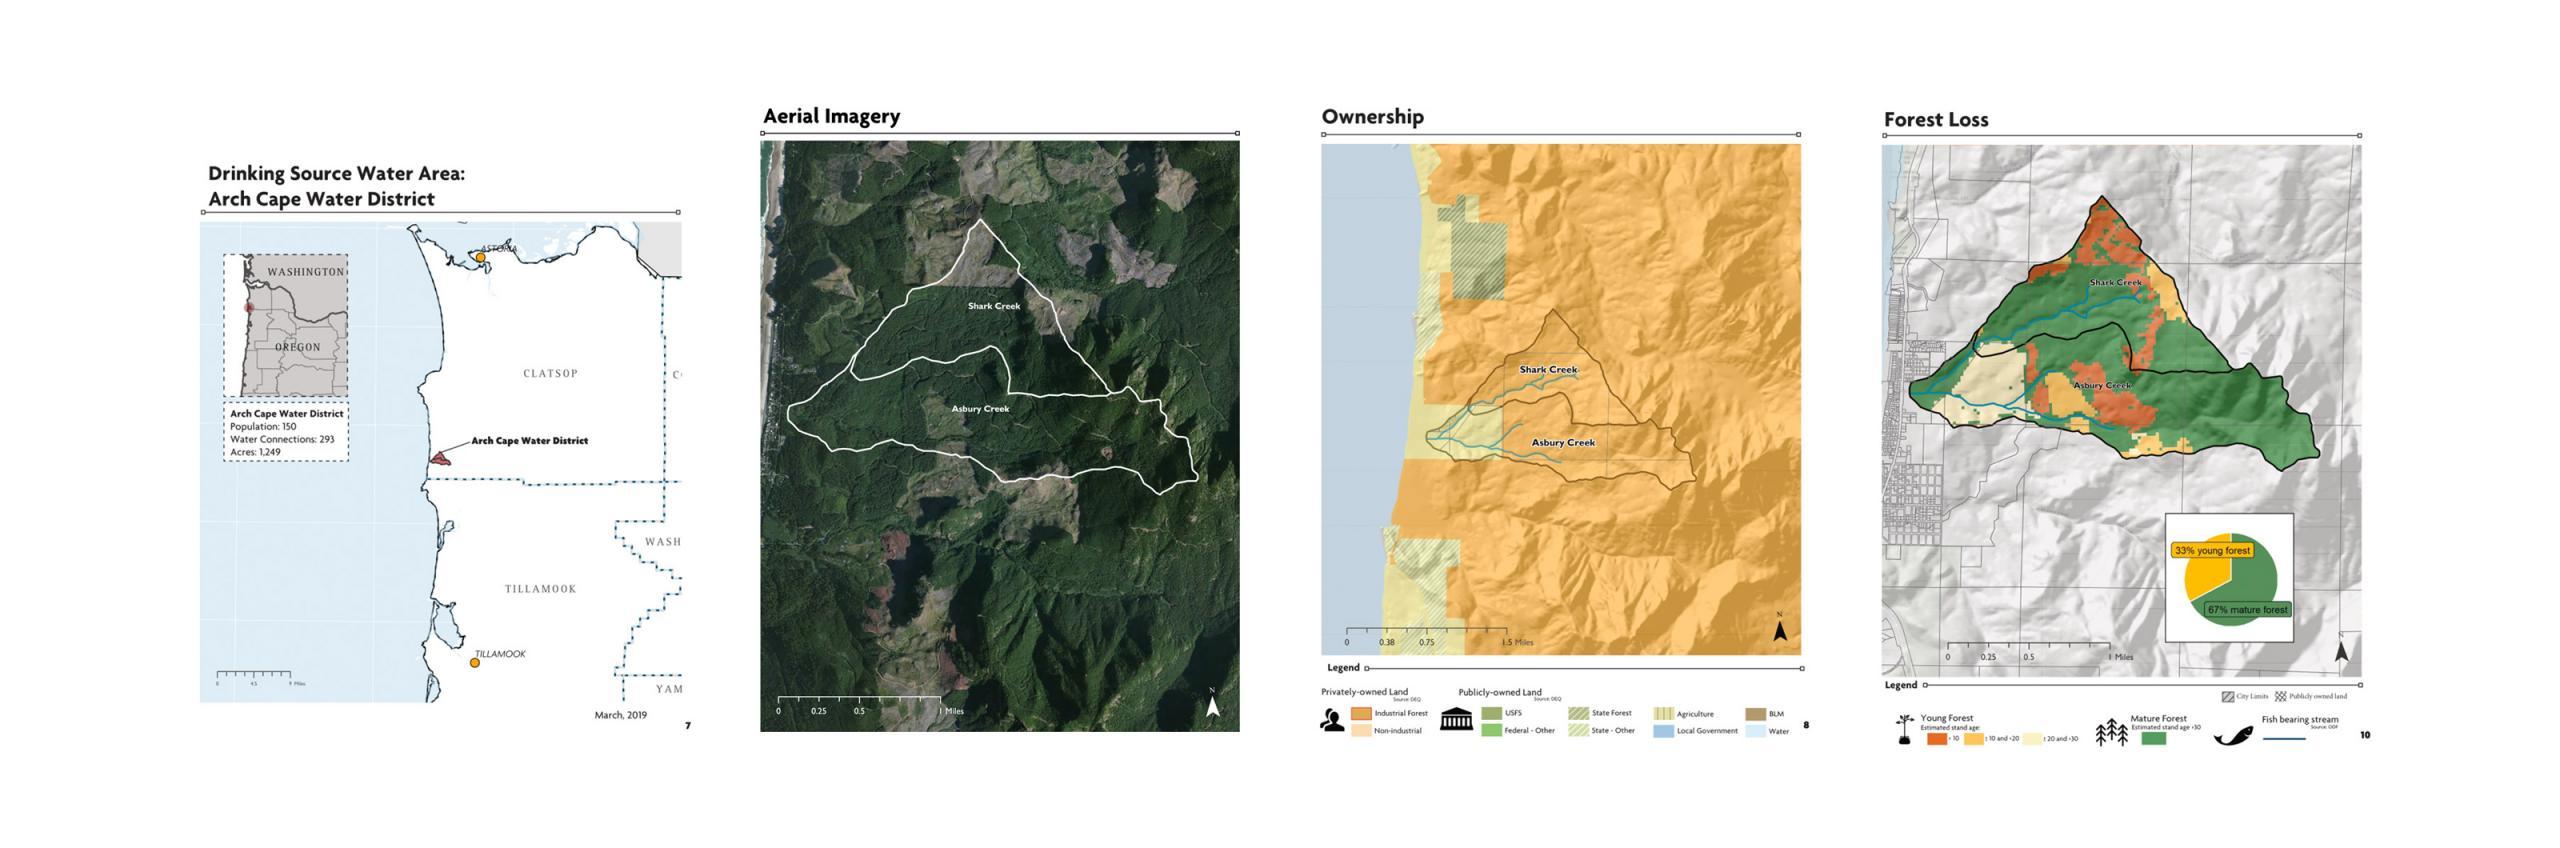
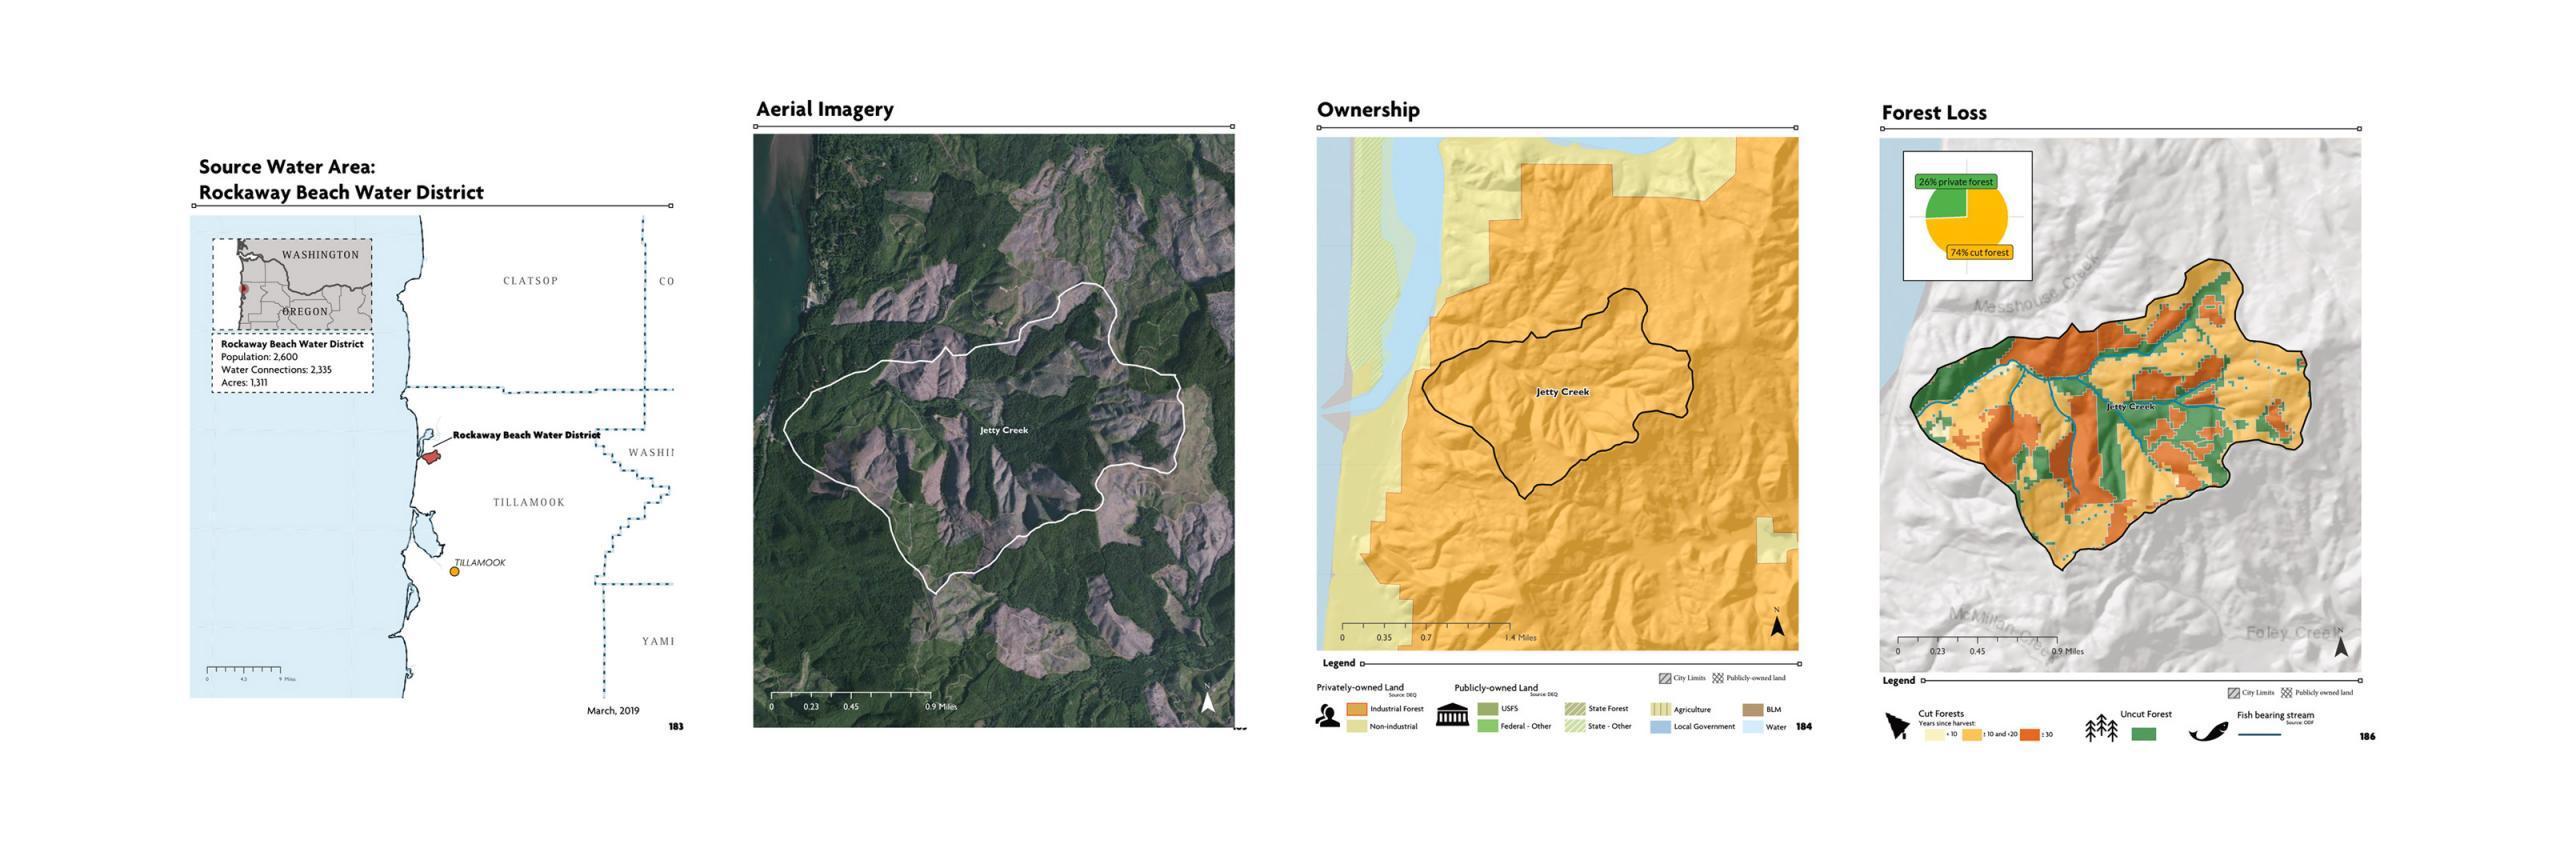
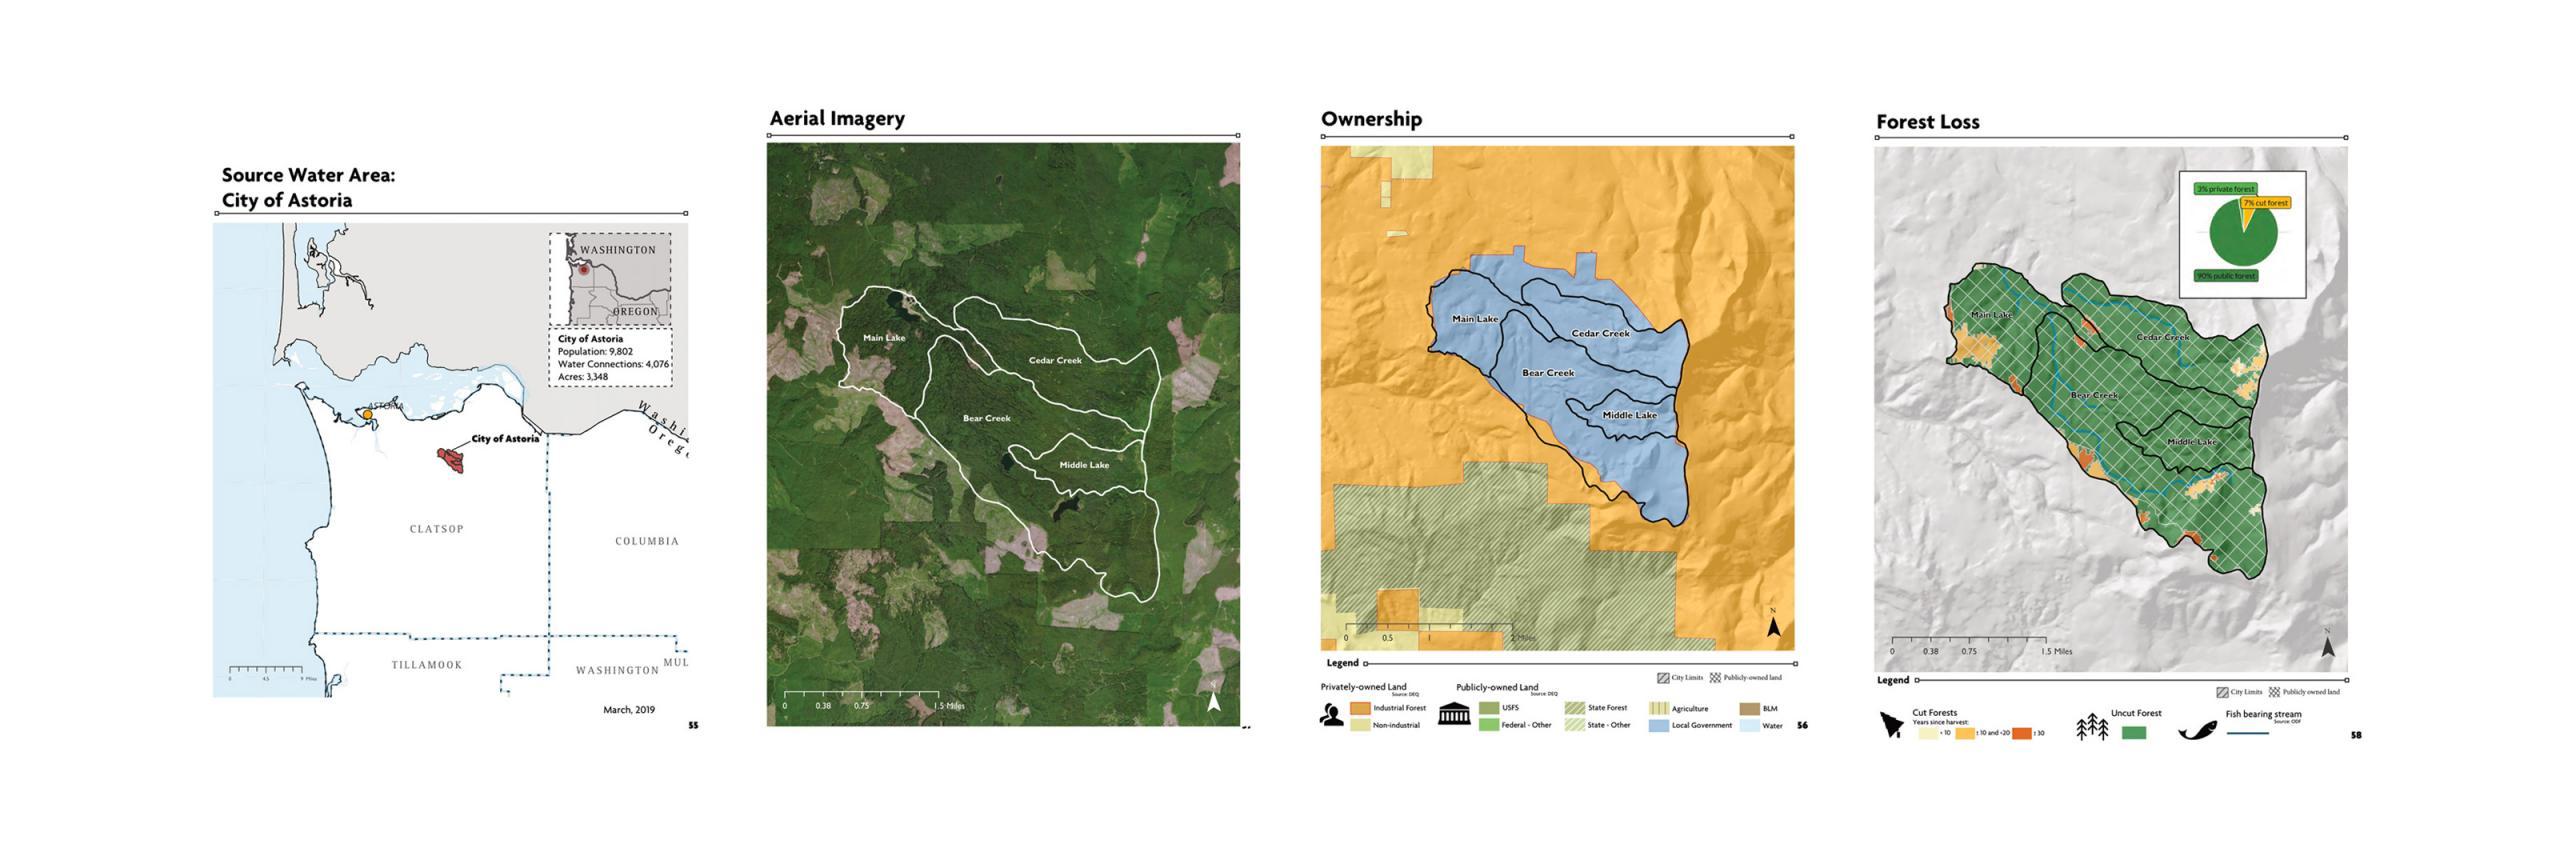
Below are a few pages from the map packets that we created for each community showing three diverse DWSAs on the coast.
The City of Arch Cape has come together with a plan to purchase a large percentage of their DWSA from private owners. The community and nonprofit partners are currently working to secure the funding needed for this acquisition, with the goal of providing clean, safe, and affordable drinking water to residents and visitors through the creation of a working community-owned forest.
Each of the 50 coastal communities of Oregon that are dependent on surface water are included in an interactive, map-based, online tool. Navigate to individual DWSAs of interest by clicking on a name within the table of contents. For each community, you will be presented with descriptive text and a list of maps to explore. All the maps are interactive, meaning you can zoom in or out and pan to other locations. You can also download a PDF of the full set of maps available for each community, including land ownership, ecology, forest age, landslide susceptibility, and potential contaminant sources.
Check it out and get in touch for more information or questions on navigating or use.

BLOG
Jamese Kwele spoke on centering equity in climate solutions panel hosted by Rep. Blumenauer

Blog
Charting timelines of timber output and carbon sequestration for every county in the Northwest US

Publication
A new look at the relationship between forest land ownership, timber production, and climate in the Pacific Northwest.