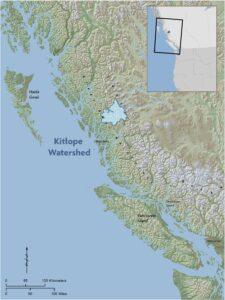
This map of the largest unlogged watershed on the West Coast set the stage for a major protection campaign by the Haisla, Ecotrust and local and international partners. In 1994, British Columbia protected the area as the Kitlope Heritage Conservancy.
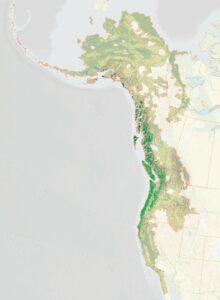
In the early 1990s, Ecotrust founder Spencer Beebe and colleagues began mapping the world’s rare coastal temperate rain forests. They found that nearly 50 percent of the original forest (Pacific Northwest historical forest is dark green, above) had been lost. But the biggest stand left was in the Pacific Northwest, stretching from northern California to Southeast Alaska. Born and raised in Oregon, Beebe decided to localize his international focus to “the rain forests of home.” Ecotrust would be the vehicle for this new regionally focused work.
Willapa Bay supplies much of the Northwest’s oysters; Ecotrust mapped the key cultural and ecological characteristics of the area—including the important oddity of privately owned tidelands—as part of outreach efforts there.
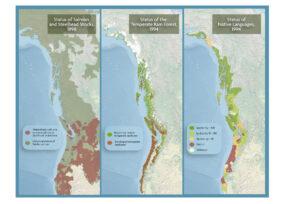
Placing Ecotrust’s maps of native language loss, forest cover loss and salmon species loss shows an unmistakable pattern of interconnectedness between humans and ecosystems. In 1998, we also created the first-ever comprehensive view of North Pacific salmon stocks brought together data from a bevy of public agencies, and tracked salmon health across all of the region’s medium-sized watersheds.
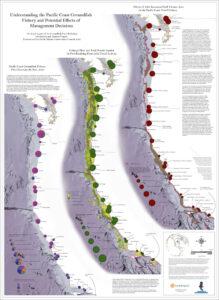
This marked Ecotrust’s entry into marine spatial planning. When the Pacific Fisheries Management Council announced a closure of groundfishing in 2002, Ecotrust was able to map out the uneven economic effects of that closure on West Coast ports and fishermen. The maps demonstrated the value of spatial analysis in fully understanding the consequences of ocean management decisions.
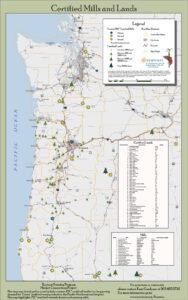
The first map of its kind allowed Northwest timberland owners considering Forest Stewardship Council certification to gauge the cost of getting their product to market, via certified mills. Ecotrust has since invested considerable resources expanding FSC-certified timber supply and mill capacity.
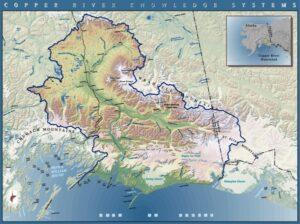
This continued our efforts to chart important watersheds and assess the work needed to protect and restore their health. Ecotrust built a living catalog of Copper River knowledge and helped establish Alaska’s first inter-tribal conservation district to co-manage the river.
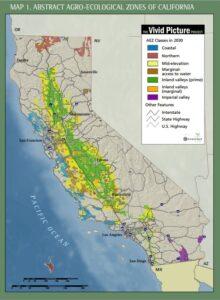
Inventing a new way of looking at agricultural zones, our maps for the Vivid Picture project in California used a mix of environmental and cultural factors to classify growing regions in the state. Leveraging this new map, we analyzed the future effects of climate change and water policy.
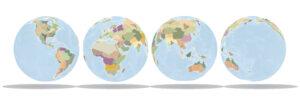
Taking our bioregional cartography to a global scale, we built a catalog of regions around local similarities in environmental and cultural factors — language, precipiation, vegetation, among others — in an attempt to remap the world. This approach allows communities and regions to re-envision how they operate.
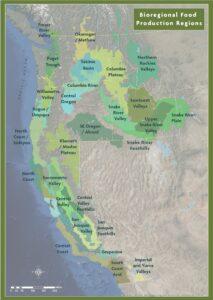
We established new agricultural zones based on environmental and human factors. As we begin to model climate change across the region, this mapping system will help us understand how factors like temperature or water will be affected in each of our zones.
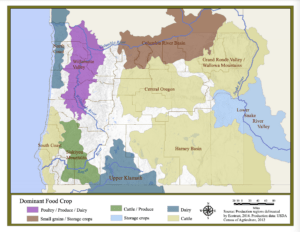
This map shows the major growing regions across the state of Oregon, highlighting the primary products produced in that area. The inherent heterogeneity of production is dependent on a wide array of geoclimatic and anthropogenic factors, but rarely follow political boundaries. Infrastructure capacity has also emerged differently in different regions due not only to production possibilities and market demand, but also because of varying access to markets, technology lock-in, and path dependence. Learn more from our Oregon Food Infrastructure Gap Analysis.
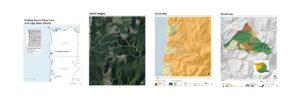
To help coastal communities plan for a more populous and increasingly climate-constrained future, we published data and information specific to the 50 coastal communities that depend on surface sources for drinking water in an interactive web tool. By providing landscape-level context for this important resource, these maps may be useful in helping communities develop and implement drinking water protection strategies. The above map is a sample from the map packets that we created for Arch Cape Water District and represents one of the many diverse Drinking Water Source Areas in coastal Oregon. Learn more from our blog post.